🧠 Introduction: When the Economy Recovers… But Your Finances Don’t
“The economy recovered. The stock market hit new highs. So why did so many Americans still feel stuck?”
That question sits at the heart of one of the most important economic periods in modern U.S. history.
Between 2008 and 2016, the country experienced a dramatic shift—moving from crisis to recovery under leaders like Barack Obama, followed by a contentious political transition involving figures such as Hillary Clinton and Bernie Sanders.
But strip away the political narratives, and something deeper emerges.
This isn’t just a story about elections or policy debates. It’s about how economic decisions at the top filter down—or fail to filter down—to everyday households.
For millions of Americans, the official story said:
- The recession ended
- Markets rebounded
- Growth returned
Yet their personal experience told a different story:
- Wages felt stagnant
- Costs kept rising
- Financial stability remained fragile
🎯 The Core Thesis
The biggest divide in the 2008–2016 period wasn’t political—it was the gap between economic data and lived financial experience.
Understanding that gap is critical—not just for interpreting the past, but for making smarter financial decisions today.
📉 The Financial Crisis: Where It All Began for the Average Household
📊 What Happened to the Economy
The starting point is the Global Financial Crisis—a systemic breakdown that reshaped the financial landscape.
At a high level, the damage was severe:
- Housing market collapse:
Home values fell nationwide, in many cases by 30%–50%, wiping out trillions in household wealth. - Massive job losses:
More than 8 million jobs were lost during the recession, pushing unemployment close to 10%. - Retirement account declines:
Stock market losses cut many 401(k) balances nearly in half at the worst point.
These weren’t isolated events—they were interconnected failures across housing, banking, and labor markets.
👉 The system didn’t just slow down—it broke under pressure.
🏠 What Happened to the Average American
While the macroeconomic story is important, the real impact was felt at the household level.
For the average American, the crisis translated into immediate and often lasting financial consequences:
- Lost home equity:
For many families, their home was their largest asset. As prices fell, so did their net worth—sometimes overnight. - Job insecurity or unemployment:
Layoffs, reduced hours, and wage cuts became common, even among previously stable careers. - Increased reliance on credit:
With incomes disrupted, many households turned to credit cards, personal loans, or home equity lines just to stay afloat.
This created a dangerous cycle:
- Falling income
- Rising debt
- Shrinking assets
👉 A financial squeeze that didn’t disappear when the recession officially ended.
💡 Key Insight
For most households, wealth = home + income—not stocks.
That distinction matters.
While financial markets eventually recovered, many households:
- Didn’t own significant stocks
- Were still recovering from housing losses
- Faced ongoing income pressure
Which helps explain one of the most important—and misunderstood—realities of this era:
The economy can recover on paper long before it recovers in people’s lives.
🏦 Stabilizing the System vs. Stabilizing Your Finances
One of the most misunderstood aspects of the post-crisis recovery is this:
The system was stabilized quickly—but households were not.
From a policy perspective, the priority during the Global Financial Crisis was clear:
prevent a total financial collapse.
That decision had consequences—both intended and unintended—for the average American.
🏦 Why Banks Recovered Faster Than People
In a crisis, policymakers focus on systemic risk—the danger that the entire financial system could fail.
To prevent that:
- Bailouts and liquidity support were deployed rapidly
- Capital injections into major banks
- Emergency lending programs from the Federal Reserve
- Credit markets were stabilized
- Ensuring banks could lend to each other
- Preventing a freeze in business and consumer lending
👉 The reasoning was straightforward:
If the financial system collapses, everything else collapses with it.
So policymakers acted fast—and at scale.
📊 The Result:
- Major financial institutions stabilized within months
- Credit markets began functioning again
- The stock market bottomed in 2009 and began a strong recovery
👉 From a macro perspective, this worked.
But from a household perspective, the story looked very different.
🏠 Why Households Lagged Behind
While the system recovered, households faced a much slower—and more painful—path.
- Foreclosures peaked years later (2009–2010):
Many families lost homes well after the official end of the recession. - Wage recovery was slow:
Even as unemployment declined, wage growth remained muted for years. - Debt burdens remained:
Households entered the recovery with:- Credit card debt
- Student loans
- Mortgage obligations
👉 Unlike banks, households didn’t receive immediate balance sheet relief.
Instead, they had to:
- Deleverage (pay down debt)
- Rebuild savings
- Recover lost income
This process takes years—not quarters.
📊 Recovery Comparison
| Area | Recovery Speed | Who Benefited First |
|---|---|---|
| Banks | Fast | Financial sector |
| Stock Market | Fast | Investors |
| Housing | Slow | Homeowners (later) |
| Wages | Very Slow | Workers |
💡 Financial Lesson
The economy can recover without your personal finances recovering.
This is one of the most important concepts in financial literacy.
Because if you assume:
- “The economy is doing well, so I should be doing well”
You risk missing the reality:
👉 Your financial health depends on your income, assets, and debt—not GDP headlines.
💰 The Illusion of Recovery: Why It Didn’t Feel Like Progress
By the early 2010s, the data told a positive story:
- Growth had returned
- Markets were rising
- Unemployment was falling
But for many Americans, it didn’t feel like progress.
That disconnect is where the idea of an “illusion of recovery” comes from.
📈 GDP vs. Household Income
At the national level:
- GDP growth resumed within a few years of the crisis
- Corporate profits recovered strongly
But at the household level:
- Median income stagnated for years
- Many families were still rebuilding from losses
📊 Data from the Federal Reserve and Census trends show:
- Income recovery lagged behind overall economic growth
- Lower- and middle-income households saw slower gains
👉 This created a critical divide:
The economy improved—but not evenly.
📊 Asset Inflation vs. Wage Growth
Another key driver of the disconnect was how the recovery occurred.
📈 What surged:
- Stock market (major indices more than doubled from 2009 lows)
- Financial assets broadly
🏠 What recovered unevenly:
- Housing (varied by region, took years to rebound)
💵 What lagged:
- Wages (slow, gradual increases)
- Purchasing power (pressured by rising costs)
👉 This matters because:
- Higher-income households tend to own more financial assets
- Lower- and middle-income households depend more on wages
📊 Structural Divide
| Category | Recovery Pattern | Impact |
|---|---|---|
| Stocks | Strong growth | Benefited investors |
| Housing | Uneven recovery | Mixed outcomes |
| Wages | Slow growth | Limited relief |
| Costs (healthcare, education) | Rising | Increased pressure |
💡 Key Takeaway
If you don’t own appreciating assets, recovery may pass you by.
This is one of the defining financial lessons of the post-2008 era.
It explains why:
- Markets can boom
- Headlines can look strong
- Yet households still feel financially constrained
🧠 Why This Matters for Your Financial Strategy
Understanding this dynamic changes how you approach money:
- You focus on building assets, not just earning income
- You recognize that policy impacts markets differently than households
- You prioritize long-term financial resilience, not short-term headlines
🎓 The Hidden Financial Pressures Building Under the Surface
By the early 2010s, the headlines suggested recovery—but beneath the surface, a different financial reality was taking shape for millions of households.
Even as unemployment declined and markets surged, core living costs continued to rise, quietly tightening the financial margin for the average American.
📈 Rising Costs
For many households, the issue wasn’t just income—it was what that income had to cover.
🏥 Healthcare (Even After the Affordable Care Act)
- More Americans gained access to insurance
- Protections for pre-existing conditions improved financial security
But:
- Premiums and deductibles increased in many cases
- Out-of-pocket costs remained a major burden
👉 Result:
Coverage improved—but affordability remained a challenge
🎓 Education (Student Debt Surge)
- Tuition costs continued rising faster than inflation
- Student loan balances expanded significantly nationwide
📊 According to data trends from the Federal Reserve:
- Student loan debt became one of the largest categories of household debt
👉 For younger households, this meant:
- Delayed homeownership
- Reduced savings capacity
- Long-term financial drag
🏠 Housing Affordability
Even after the housing crash:
- Home prices eventually rebounded—often faster than wages
- Rent increased significantly in many regions
👉 This created a paradox:
- Housing was cheaper after the crash
- But became less affordable again during the recovery
💳 Debt Expansion
As costs rose and income growth lagged, many households turned to borrowing to bridge the gap.
🎓 Student Loans Increased
- Became a long-term financial anchor for many borrowers
- Limited flexibility in budgeting and investing
💳 Credit Reliance Grew
- Credit cards used for everyday expenses
- Personal loans and refinancing became more common
👉 This created a structural shift:
Debt wasn’t just for emergencies—it became part of normal cash flow management.
🧠 Average Household Reality
More stable… but more financially stretched
That’s the defining condition of this period.
- Employment improved
- Income stabilized
- But financial pressure remained
👉 The result was a household that looked “recovered” on paper—but felt increasingly constrained in practice.
🌹 Why Bernie Sanders’ Message Resonated Financially
Against this backdrop, Bernie Sanders didn’t just run a political campaign—he articulated a financial narrative that matched lived experience.
⚖️ “The System Is Rigged” — A Financial Interpretation
Sanders’ core message wasn’t abstract—it mapped directly to what many households were experiencing.
📊 Inequality
- Wealth gains concentrated among asset holders
- Wage growth lagged behind overall economic expansion
🏢 Corporate Influence
- Perception that large institutions benefited most from policy decisions
- Bailouts and financial recovery reinforced this view
📉 Limited Upward Mobility
- Rising costs made it harder to get ahead
- Debt reduced financial flexibility
- Traditional milestones (homeownership, savings) were delayed
👉 Financial translation of the message:
The system may be growing—but it’s not working equally for everyone.
🛠️ Policies That Target Household Pain Points
What made the message particularly powerful was that it connected directly to specific financial pressures.
🎓 Student Loan Relief
- Addressed one of the fastest-growing financial burdens
- Spoke directly to younger voters and middle-class families
🏥 Healthcare Cost Reduction
- Focused not just on access—but affordability
- Targeted a major and unpredictable household expense
💵 Wage Growth Focus
- Emphasized income as the foundation of financial stability
- Recognized that rising costs without rising wages create long-term strain
💡 Why It Connected
It directly addressed the financial pain points people were still experiencing.
While broader economic messaging focused on recovery, this approach focused on:
- Monthly bills
- Debt burdens
- Cost pressures
- Financial stress
👉 In other words:
- Not the economy as measured
- But the economy as lived
🧠 Strategic Insight for Readers
This section highlights a critical financial truth:
Economic narratives that resonate are the ones that align with household cash flow—not just macro data.
For your own financial planning, that means:
- Pay attention to your cost structure, not just your income
- Monitor debt growth relative to income
- Focus on building flexibility in your financial life
🗳️ Why Hillary Clinton’s Message Missed the Mark Financially
By 2016, the economic data painted a relatively strong picture. But elections—and financial sentiment—aren’t driven by data alone.
They’re driven by how people feel about their financial reality.
That’s where the messaging of Hillary Clinton struggled to connect.
📊 “America Is Already Great” vs. Financial Reality
At the macro level, the case for optimism was real:
- The economy had expanded for several years
- Unemployment had fallen significantly
- The stock market had reached new highs
From a policy standpoint, this reflected a successful recovery following the Global Financial Crisis.
But at the household level, the experience was far less encouraging:
- Wages had only modestly improved
- Costs—especially housing, healthcare, and education—continued rising
- Many families were still rebuilding from prior losses
👉 This created a fundamental divide:
- Strong macro economy
- Weak household sentiment
⚖️ Incremental Change vs. Structural Pressure
Clinton’s policy approach largely focused on:
- Building on existing programs
- Refining healthcare and tax systems
- Incremental improvements to economic policy
From a governance perspective, this was pragmatic and realistic.
But from a household perspective, it didn’t fully address the pressure people were feeling:
- Debt burdens remained high
- Financial mobility felt limited
- Monthly budgets were still tight
👉 Voters weren’t just looking for improvement—they were looking for relief.
💡 Key Disconnect
Data said recovery—households felt pressure.
This is one of the most important dynamics in understanding both political outcomes and financial behavior.
When:
- Economic indicators improve
- But personal finances remain strained
👉 Trust in the broader system begins to erode.
🧠 The Core Financial Lesson: Your Economy vs. The Economy
To fully understand this period—and apply it to your own financial life—you need to recognize a critical distinction:
There isn’t just one economy. There are two.
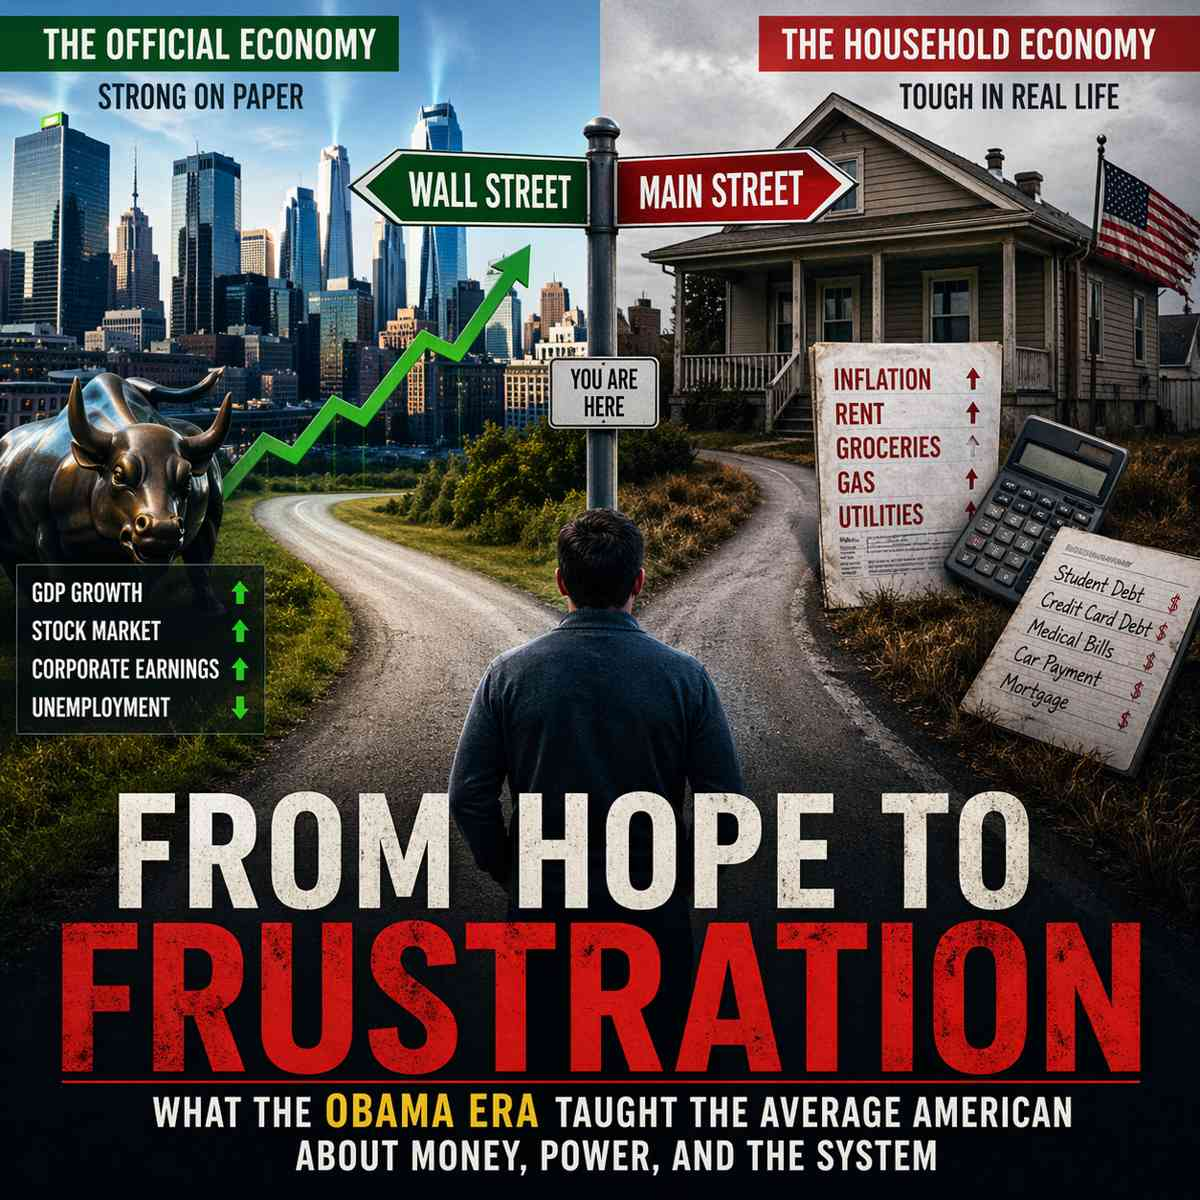
📊 Two Economies Exist Simultaneously
🏛️ The “Official Economy”
This is the version you see in headlines and policy discussions:
- GDP growth
- Stock market performance
- Corporate earnings
These indicators matter—they reflect overall economic health and stability.
But they don’t always capture how individuals are doing financially.
🏠 The “Household Economy”
This is the economy you actually live in every day:
- Income
- Expenses
- Debt
- Net worth
This determines:
- Whether you can save
- Whether you feel financially secure
- Whether you can get ahead
👉 And importantly:
- It can improve slowly—or not at all—even when the official economy is booming.
💡 Critical Insight
Political outcomes often reflect the household economy—not the official one.
This explains why:
- Strong economic data doesn’t guarantee voter satisfaction
- Market gains don’t always translate into confidence
- Recovery narratives can fail to resonate
🧠 Why This Matters for Your Financial Strategy
This distinction isn’t just academic—it’s actionable.
If you focus only on the “official economy,” you might:
- Overestimate your financial progress
- Assume conditions are better than they are
Instead, your strategy should focus on:
- Tracking your personal cash flow
- Managing expenses and debt carefully
- Building assets that grow over time
👉 Because at the end of the day:
Your financial success is determined by your household economy—not the headlines.
🏛️ Why Joe Biden’s Message Missed the Mark Financially (For Many Households)
The pattern didn’t end in 2016.
During the presidency of Joe Biden, the U.S. again experienced a disconnect between strong macroeconomic signals and strained household finances.
On paper, the economy showed resilience. In practice, many Americans felt like they were falling behind.
📊 Strong Headline Economy vs. Daily Cost Pressure
From a macro perspective, the post-pandemic economy delivered:
- Rapid job recovery following COVID disruptions
- Low unemployment rates (near historic lows)
- Strong GDP growth in multiple quarters
These are traditionally signs of a healthy economy.
But at the household level, a different reality emerged:
- Inflation surged—reaching levels not seen in decades
- Everyday costs increased:
- Groceries
- Gas
- Rent
- Insurance
👉 For many families, the question wasn’t:
“Is the economy growing?”
It was:
“Why does everything cost more, even though I’m working?”
💸 Inflation vs. Wage Growth
One of the biggest financial pressures of this period was the gap between rising prices and income growth.
- Wages did increase in many sectors
- But inflation often outpaced those gains, especially in key spending categories
👉 This led to a critical outcome:
Real purchasing power declined for many households.
Even if paychecks were larger, they didn’t go as far.
🏠 Housing and Interest Rate Shock
Another major pressure point:
- Home prices surged during the pandemic-era housing boom
- The Federal Reserve raised interest rates aggressively to combat inflation
👉 The result:
- Mortgage rates doubled (or more) in a short period
- Monthly payments became significantly less affordable
- First-time buyers were pushed out of the market
At the same time:
- Rent remained elevated
- Housing supply constraints persisted
👉 Housing became one of the clearest examples of:
A strong market that felt inaccessible to the average person.
🎓 Student Loans and Delayed Relief
Student debt remained a central issue:
- Payments were paused during the pandemic
- Broader forgiveness efforts faced legal and political challenges
👉 For many borrowers:
- Relief felt uncertain or temporary
- Long-term solutions remained unclear
This reinforced the broader theme:
Financial pressure wasn’t fully resolved—it was deferred.
⚖️ Policy Wins vs. Perceived Impact
The administration passed major legislation:
- Infrastructure investment
- Industrial policy (e.g., manufacturing and supply chain initiatives)
- Economic support programs
But many of these:
- Were long-term in nature
- Didn’t immediately reduce monthly expenses
👉 This created a familiar dynamic:
- Policy success at the structural level
- Limited immediate relief at the household level
💡 Key Disconnect
The economy added jobs—but household budgets felt tighter.
This mirrors earlier periods:
- Strong macro indicators
- Weak or strained household experience
🧠 Financial Insight: Inflation Changes Everything
If the 2008–2016 period taught one lesson (asset-driven recovery), the post-2020 period reinforced another:
Inflation is one of the most powerful forces affecting your financial life.
Because inflation:
- Impacts every dollar you spend
- Reduces real income
- Increases financial stress—even during economic growth
🏁 Why This Pattern Keeps Repeating
Across multiple administrations—from Barack Obama to Joe Biden—a consistent pattern emerges:
🔁 The Modern Economic Disconnect
- Crisis occurs
- Policy stabilizes the system
- Macro indicators improve
- Household pressures persist
- Voters feel the gap
💡 Final Takeaway for Readers
A “strong economy” doesn’t guarantee a strong financial life.
To protect yourself, focus on:
- Managing rising costs proactively
- Building income resilience
- Investing to stay ahead of inflation
- Avoiding over-reliance on economic headlines
🔍 Reflection Prompt
Ask yourself:
“Is my financial situation improving—or am I just being told the economy is improving?”
That question alone can shift how you approach:
- Budgeting
- Investing
- Long-term planning
🧠 The Core Financial Lesson: Your Economy vs. The Economy
If there is one lesson that cuts through every phase of this period—from crisis to recovery to political shift—it’s this:
There isn’t just one economy. There are two—and they don’t always move together.
Understanding this distinction is foundational to both financial literacy and real-world decision-making.
📊 Two Economies Exist Simultaneously
🏛️ The “Official Economy”
This is the version of the economy you hear about in headlines, policy briefings, and market commentary.
It includes:
- GDP (Gross Domestic Product)
Measures overall economic output and growth - Stock market performance
Reflects investor sentiment and corporate valuation - Corporate earnings
Tracks profitability and business expansion
👉 These indicators are important—they signal system stability and growth.
But they don’t tell the full story.
🏠 The “Household Economy”
This is the economy you actually experience every day.
It includes:
- Income
Your wages, salary, or business earnings - Expenses
Housing, food, healthcare, transportation - Debt
Mortgages, student loans, credit cards - Net worth
What you own minus what you owe
👉 This determines:
- Whether you can save
- Whether you feel financially secure
- Whether you can build wealth over time
⚖️ Why the Gap Exists
The “official economy” tends to benefit:
- Asset holders
- Corporations
- Investors
The “household economy” depends on:
- Wage growth
- Cost control
- Debt management
👉 When asset growth outpaces wage growth, a disconnect forms.
💡 Critical Insight
Political outcomes often reflect the household economy—not the official one.
This explains why:
- Strong GDP growth doesn’t guarantee voter satisfaction
- Market highs don’t translate into financial confidence
- Economic “success” can still feel like personal struggle
📊 Financial Reality Check: Where Did the Gains Actually Go?
To fully understand the post-crisis recovery, you have to look at who benefited first—and how those gains were distributed.
The data tells a clear story:
| Category | Outcome (2009–2016) | Who Benefited |
|---|---|---|
| Stock Market | Strong growth | Investors |
| Real Estate | Uneven recovery | Owners (later) |
| Wages | Slow growth | Workers lagged |
| Student Debt | Increased | Borrowers burdened |
📈 What This Table Reveals
1. Asset Owners Recovered First
- Investors benefited from rising stock prices
- Those with capital saw faster wealth recovery
2. Housing Took Time—and Was Uneven
- Some regions recovered quickly
- Others lagged for years
3. Workers Fell Behind
- Wage growth was slow and inconsistent
- Purchasing power didn’t fully keep pace
4. Debt Became a Structural Burden
- Student loans increased significantly
- Many households carried long-term financial constraints
🧠 What This Means for Your Financial Strategy
This isn’t just historical—it’s actionable.
If you want to avoid being left behind in future economic cycles:
🔑 Focus on These Principles
- Build assets early and consistently
→ Investing matters more than timing headlines - Control your cost structure
→ Rising expenses can erase income gains - Manage debt strategically
→ Debt can either support growth—or restrict it - Track your own metrics—not just economic news
→ Your net worth matters more than GDP
🏁 Bottom Line
The economy can grow… while your finances stagnate.
The difference comes down to:
- What you own
- What you earn
- What you owe
And most importantly:
How you respond to the environment—not just how you observe it.
🔁 Are We Seeing This Pattern Again Today?
If this story feels familiar, it’s because the same structural dynamics continue to show up in modern economic cycles.
The details change—but the pattern often repeats.
📉 Inflation vs. Wage Growth
In recent years:
- Wages have increased in many sectors
- But inflation has surged, especially in essential categories
Households are feeling it in real time:
- Groceries cost more
- Insurance premiums rise
- Utilities and transportation expenses increase
👉 The result:
Even when income grows, purchasing power can shrink.
This creates a quiet but powerful financial squeeze.
📈 Asset Markets vs. Affordability
At the same time:
- Asset markets (stocks, real estate) have shown strong performance in certain periods
- But affordability has become a major barrier
Examples:
- Higher home prices combined with elevated interest rates
- Investment gains concentrated among those already invested
👉 This reinforces a key divide:
- Those who own assets often benefit from growth
- Those relying primarily on income face rising costs
🧠 Economic Headlines vs. Personal Experience
You’ve likely seen headlines like:
- “Economy remains strong”
- “Job market is resilient”
Yet many households feel:
- Financially stretched
- Uncertain about the future
- Unable to get ahead
👉 This is the same disconnect we saw before:
The official economy may look strong—while the household economy feels strained.
💡 Reflection Prompt
Take a moment to assess your own situation:
“Does today’s economy feel strong—or just look strong on paper?”
Your answer to that question is more important than any headline.
Because it reflects your:
- Cash flow
- Financial flexibility
- Long-term trajectory
🏁 Conclusion: Why This Still Matters
The lesson from this entire period is both simple and powerful:
Economic systems can stabilize while households continue to struggle.
We’ve seen it:
- After the financial crisis
- During the recovery years
- And again in more recent economic conditions
That’s why relying solely on:
- Headlines
- Market performance
- Government data
…can give you an incomplete picture of your financial reality.
💡 Financial Empowerment Starts With Awareness
The real advantage comes from understanding how these systems work—and how they impact you directly.
When you recognize the difference between:
- The economy
- And your economy
👉 You gain control over your financial decisions.
🧠 What This Means for You
- Financial literacy is not optional—it’s essential
- You must evaluate your own financial health independently
- Long-term success depends on how you:
- Manage income
- Control expenses
- Build assets
- Reduce unnecessary debt
💡 Call to Action
Ready to take control of your financial future?
Start here:
- 👉 Explore your Policy History & Long-Term Outcomes
🏁 Final Thought
Don’t measure your financial success by the headlines—measure it by your progress.
Because in the end:
👉 Your financial future is built in your household economy—not the official one.
Check out our other posts like: